
2015 Amazon Affiliate Income Progress Report
Now that I have decided to really focus on being an Amazon affiliate, let me share with you the status of my Amazon affiliate income for 2015 as well as website traffic.
This will be a good baseline for us to compare moving forward in terms of how our content creation, website optimization, and marketing activities will improve these numbers.
As I mentioned in this post, being an Amazon affiliate hasn’t been my primary focus up till this point. I have signed up with multiple affiliate programs and promoted various types of products but Amazon affiliate program seems to give the most significant result.
Also, I have been creating websites to experiment on various SEO strategies rather than purely for making money. This might have prevented me from making easy money, but on the flip side, my websites are all created and maintained with White Hat SEO in mind.
Amazon affiliate income for 2015
The numbers shown here are from my entire website portfolio excluding sites that have little or no Amazon affiliate links.
I am actually surprised that there was one advertising fee income from recommending audible, which I don’t recall promoting it on my sites.
This is one of the reasons why I am excited about Amazon affiliate; once the person who clicked on your Amazon affiliate link lands on Amazon, you will earn commission on almost EVERYTHING that person buys (there are some products Amazon does not pay commision – for more details please visit this page on Amazon associate site).
This means even if the product you are promoting only cost $50, if the person who clicked on the link ended up spending $1000, you will get commission for $1000.

How good is it to be an Amazon affiliate? Show me the numbers
Tables below are the summary of website traffic and break down revenue for each site. I do have few other sites that only had small amount of Amazon affiliate code and did not generate substantial revenue so I left them out.
I included PVN because that site primarily had Amazon affiliate code (90%) with some Clickbank (5%) and Shareasale code (5%) even though it did not generate any money.
I also included HEG because it also had about 50% Amazon affiliate code and 50% Rakuten Affiliate Marketing program, then later we converted it to 100% Amazon affiliate code.
It’s also important to point out TRI is not a 100% Amazon affiliate site but to make the calculation simpler, we are treating it as if, it is an Amazon affiliate site.
ASS was built from ground up to be 100% Amazon affiliate site.
Additionally, my Amazon affiliate account got banned in early 2015, so there were no revenue from Amazon affiliate program for about 6-8 weeks in 2015.


As you can see ASS performed particularly well with the highest advertising fee (= commission the site earned). This makes sense because that is the website that we worked on primarily from making money using Amazon affiliate standpoint. Here is the history of the site.
March 2015: ASS was created with 12 pieces of legacy content. By legacy content I meant they were created in 2013 when I had about 20 niche websites and were experimenting with Black Hat SEO techniques (I no longer use Black Hat techniques of course). The word count for these pages are only about 500 words each.
April 2015: Added 31 brand new posts, each with at least 1000 words.
June 2015: Mapped out internal linking strategy and implemented some of it. This is still work in progress. Saw slight increase in traffic.
August 2015: Removed excess Amazon affiliate links. We had more than 30 Amazon affiliate links on each post. We removed most of them and implemented a new scheme to entice users to click on it.
October 2015: Published another 10 brand new posts with an improved content creation method. Word count for each post is about 1000 words.
November 2015: Finished first round of content optimization.
December 2015: Finished second round of content optimization. Primarily focused on H1 and H2 optimization.
Overall, the site currently has 53 posts but obviously not all of them are bringing in organic traffic, especially the 12 legacy content do rank lower in comparison to the newer content because of their lower content quality and content count.
Moving forward, we plan to create content in batches so let me introduce the following four metrics to help us measure performance of each post.
How to measure performance of each post
NOTE: the data is calculated using one year traffic and Amazon Affiliate data.

1) Average Traffic Acquisition Per Post (ATAPP)
Total Traffic / Number of Posts = Average Traffic Acquisition Per Post
ATAPP can essentially tell us how well on average each post is performing in terms of how much traffic they are brining in.
How to use this data: ASS as an example
ATAPP for ASS is about 69 which is almost half of TRI. This is understandable because I know TRI brings in substantial social media traffic (we have experimented with social media platform traffic generation but that’s a story for another time) and we are not really comparing apple to apple.
What I mean is ASS has been built to primarily target organic traffic so since we are using total traffic for this calculation, it doesn’t show if ASS is better or worse than TRI in terms of its organic search performance.
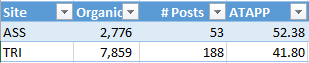
By pulling the organic data from each site, we can see ASS is actually performing well than TRI with ASS=52.38 and TRI=41.80.
This basically means each post on ASS brought in 52 people to the site via organic search channel.
2) Average Click Through Per Post (ACTPP)
Total Clicks / Number of Posts = Average Click Through Per Post
ACTPP can tell us the performance of each post for how many people clicked on the Amazon affiliate link and reached to Amazon.com.
How to use this data: ASS as an example
On average, each ASS post is sending almost 29 people to Amazon in 2015.
We have improved the user experience a few times in 2015 and as mentioned earlier we also modified how we presented the Amazon affiliate links on the site. We can use this metrics to learn if any improvements that we made to increase more clicks has worked or not.
3) Average Conversion Per Post (ACPP)
Total Items Orders / Number of Posts = Average Conversion Per Post
ACPP can tell us the performance of each post for how many orders people are placing after reaching to Amazon.com.
How to use this data: ASS as an example
ASS site had 2.04 ACPP in 2015 which is the highest amongst the sites I presented here.
There are several factors I can think of that can influence this number. If you have other ideas please share them in the comment. Would love to learn your thoughts.
Is the product we are promoting expensive?
If we are promoting expensive products on the site, most likely ACPP will be low unless it’s something that people buy in bulk. For example, it’s unlikely that someone will buy multiple office chairs in one go.
Is the product we are promoting complementary to other products?
If there are complementary products that are needed in addition to the product we are promoting, this number could be higher. For example, if our site promotes kindle, most likely people would also want to buy Kindle cover at the same time.
Is our content relevant to the products we are promoting?
If the products we are promoting are not relevant to what’s discussed in the post, most likely people will just leave even if we managed to send them to Amazon.
What kind of posts are sending the traffic to Amazon?
Each article should be created with purchase funnel in mind. This will allow us to tailor the content to buyer’s physiology at that specific buying stage.
Here is a list of posts that discussed about purchase funnel.
- How To Rank My Website? Keyword Research That Works!
- Persona + Buyer’s Journey = Powerful Content
- Creating Buyer Personas – Quick And Dirty With Facebook Data
4) Average Revenue Per Post (ARPP)
Total Revenue / Number of Posts = Average Revenue Per Post
ARPP can tell us on average how much money each post is generating from Amazon affiliate.
How to use this data: ASS as an example
This can be used to calculate Return Of Investment (ROI) that we are interested in.
According to the data, ARPP for ASS post is 5. This means each post on ASS generated $5 in 2015.
Let’s say if it costs us to create one article for $15. This means it will take us 3 years to recoup the cost ($5 x 3 = $15). If we add other costs, it will take much longer.
So for a rough calculation, I came up with the following cost number for each post.
Operational cost (Article upload + SEO work) + hosting cost + marketing (if any) = $10/year
This is a troublesome news because the money each post makes in a year is $5 so it does not even cover the operation cost of $10.
As you can see this tells us we need to work on increasing ARPP and look for ways to lower cost to make it profitable.
Are we ready?
Now that we have figured out what our starting point is, the next step is to start creating new content! (This link goes to a future post so it will work in a few days).
Do you think these metrics will help you measure your content performance? What’s your content ARPP? Let’s compare to see who has the highest number and let’s share ideas on how to achieve it!
I build websites and use them for testing various SEO strategies and tactics.
LinkedIn Profile
- How To Track Keyword Ranking? - April 27, 2020
- Is Updating Old Content For SEO Worth It? - March 30, 2020
- What Is Remote Desktop Access (a.k.a RDP Or VPS) For SEO? - March 27, 2020


Hi Tony,
Just finished looking through one of your Affiliate Income Reports! It’s great when people put hard stats into their posts . . . it helps and I appreciate it! I do have one quick question. Do you have a quantitative estimate of how much of your affiliate revenue comes from customers that buy completely different products during the lifespan of your cookie than those explicitly linked to? Thinking of building an affiliate site that revolves around low-income easy-to-rank-for keywords that would rely on peoples’ general spending in the 24 hours following the link click.
Thank you so much!
Wesley
That is a good strategy. Amazon does have a record title as “all other items ordered” and looking back on the order history in my account, it is way higher than the orders through the actual product links. In fact, about 90% are from other items.